Analyze Results
Use Analyze Results to group and rank records in a results set by extracting data values from a variety of fields. Find the most prevalent authors in a particular field of study or generate a list of institutions ranked by record count based on your search query.
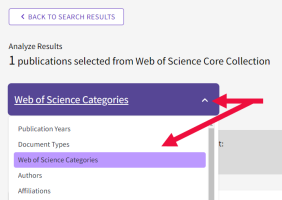
- Click Analyze Results on any search results page. By default, Web of Science analyzes by the first field listed on in the field menu. A chart of the top field values displays at the top of the page and a data table of the top field values displays below that image; the top field values from the selected field are listed along with their record count.
- Select a field to analyze from the drop-down menu.
Visualization
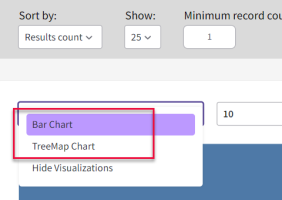
The visualization at the top of the page shows up to 25 values. You can change the visualization from a TreeMap Chart to a Bar Chart. In addition, you can download a JPG image of the visualization and hide it (Hide Visualizations) if you want to only focus on the data table.
Data Table
The data table displays up to 500 values. You can also change the sort order and set the minimum record count.
Sort By
Sort by sorts the visualization and data table alphabetically (from A-Z or numerically from 0-9) or by Results Count![]() Ranks the values from high to low, according to the number of records in which each value (minimum record count) appears..
Ranks the values from high to low, according to the number of records in which each value (minimum record count) appears..
Minimum Record Count
To be listed in the results table and the visualization, a value must appear a given number of times in the set. For example, if you select Author and set a minimum record count to 4, then an author's name is included in the results table if it appears in four or more records.
After viewing selected or excluding selected values, the results page lists the records from the original set that match your selections. This new set is added to the Search History table.
To view records containing field values that appear in the results report:
- select the checkbox of each field value you want to view.
- click Refine Results by Selected from the bottom of the data table to view records that contain the selected field values.
The formula for calculating the number that appears in this column (column to the right of the Record Count column) is as follows.
Record Count ÷ Number of Records Analyzed x 100
Example: 9 ÷ 349 x 100 = 2.5788 %
Follow these steps to save results and view them in Microsoft Excel:
- Select Data rows displayed in table or All data rows (up to 100,000) and click Download Data Table.
- A file, analyze.txt, downloads to your computer. To view it, open Microsoft Excel.
- Click Browse to navigate to the folder where you downloaded the file.
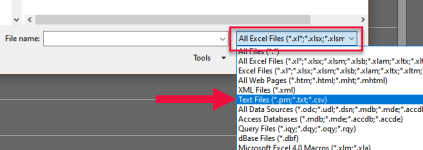
- You will need to click the drop-down menu next to the File name field and select Text Files to see the file in the folder:
- Select the file and click Open.
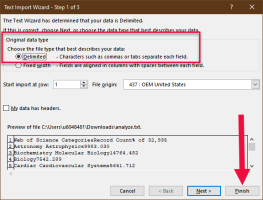
- Select Delimited under Original data type and click Finish.


